

Debugging AWS AppSync APIs With CloudWatch
The Anatomy of the AWS AppSync CloudWatch Logs

B
👨💻 Sofware Engineer · 💬 Consultant · 🚀 Indie Maker · ⚡️ Serverless
🔧 serverless-appsync-plugin · serverless-appsync-simulator · middy-appsync
🐈 and 🍵
Search for a command to run...
The Anatomy of the AWS AppSync CloudWatch Logs
👨💻 Sofware Engineer · 💬 Consultant · 🚀 Indie Maker · ⚡️ Serverless
🔧 serverless-appsync-plugin · serverless-appsync-simulator · middy-appsync
🐈 and 🍵
I´m having problems when ingesting the cloudwatch logs to a third party APM tool. The log group is created separetely for each API and normally you have to attach each log group on a trigger to ingest via lambda function. Do you have any solutions to group API logs in one log group?
I don't think this is possible. At least not at this time. Each API has its own log group by default, and you cannot change it.
The only thing you can do is attach the same Lambda to each individual log group.
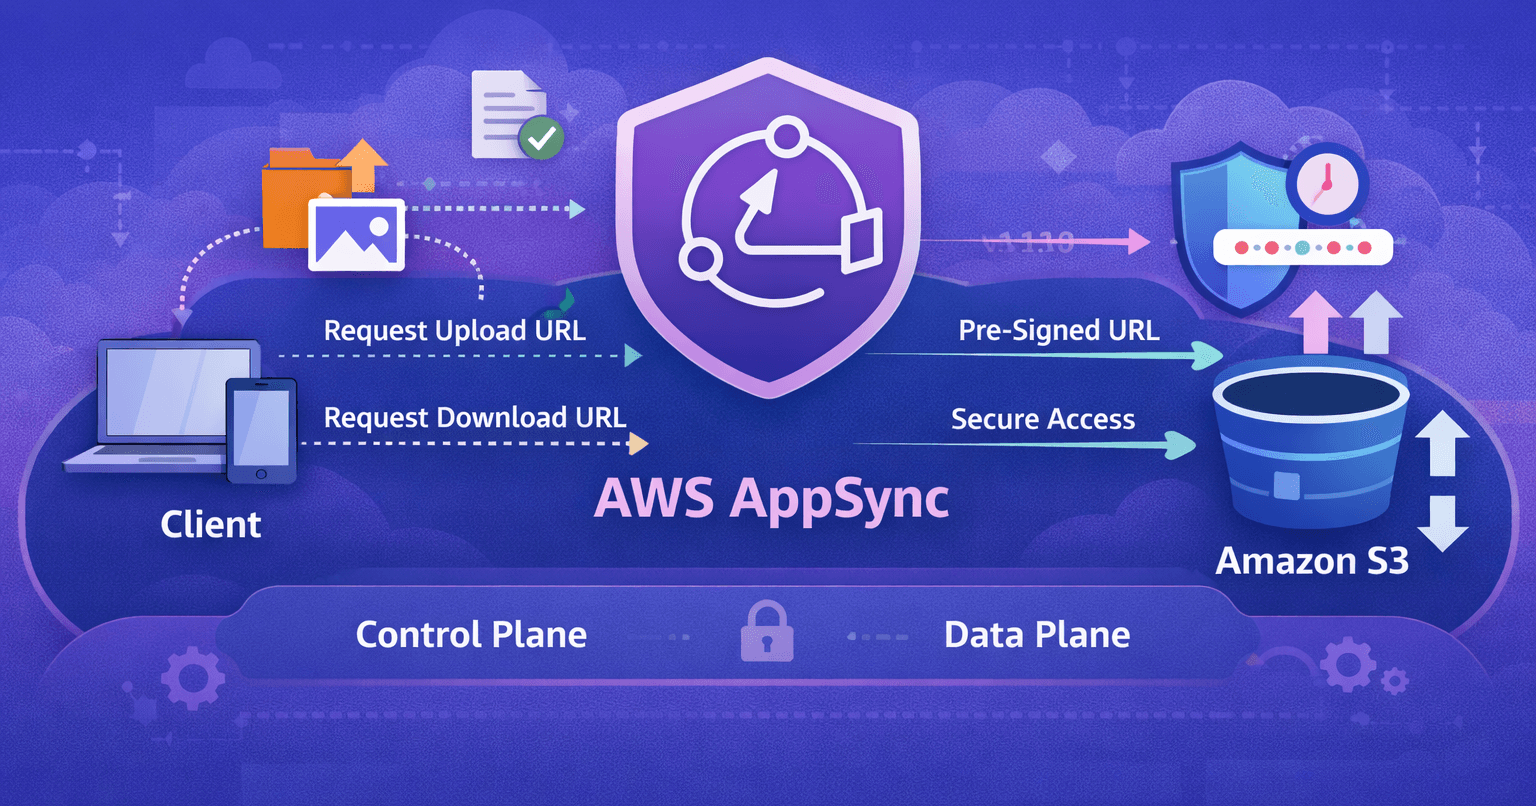
How to Generate Files on Demand and Deliver Download URLs Using GraphQL Subscriptions
Using Pre-Signed URLs for Scalable, Secure File Handling in GraphQL APIs
Find the path to achieving AppSync excellence, by following those simple best practices

Over the past years, event-driven architecture has become more and more popular. With the arrival of services such as EventBridge and its integration with many other AWS services, building such applications has become easier than ever. Last year, AWS...

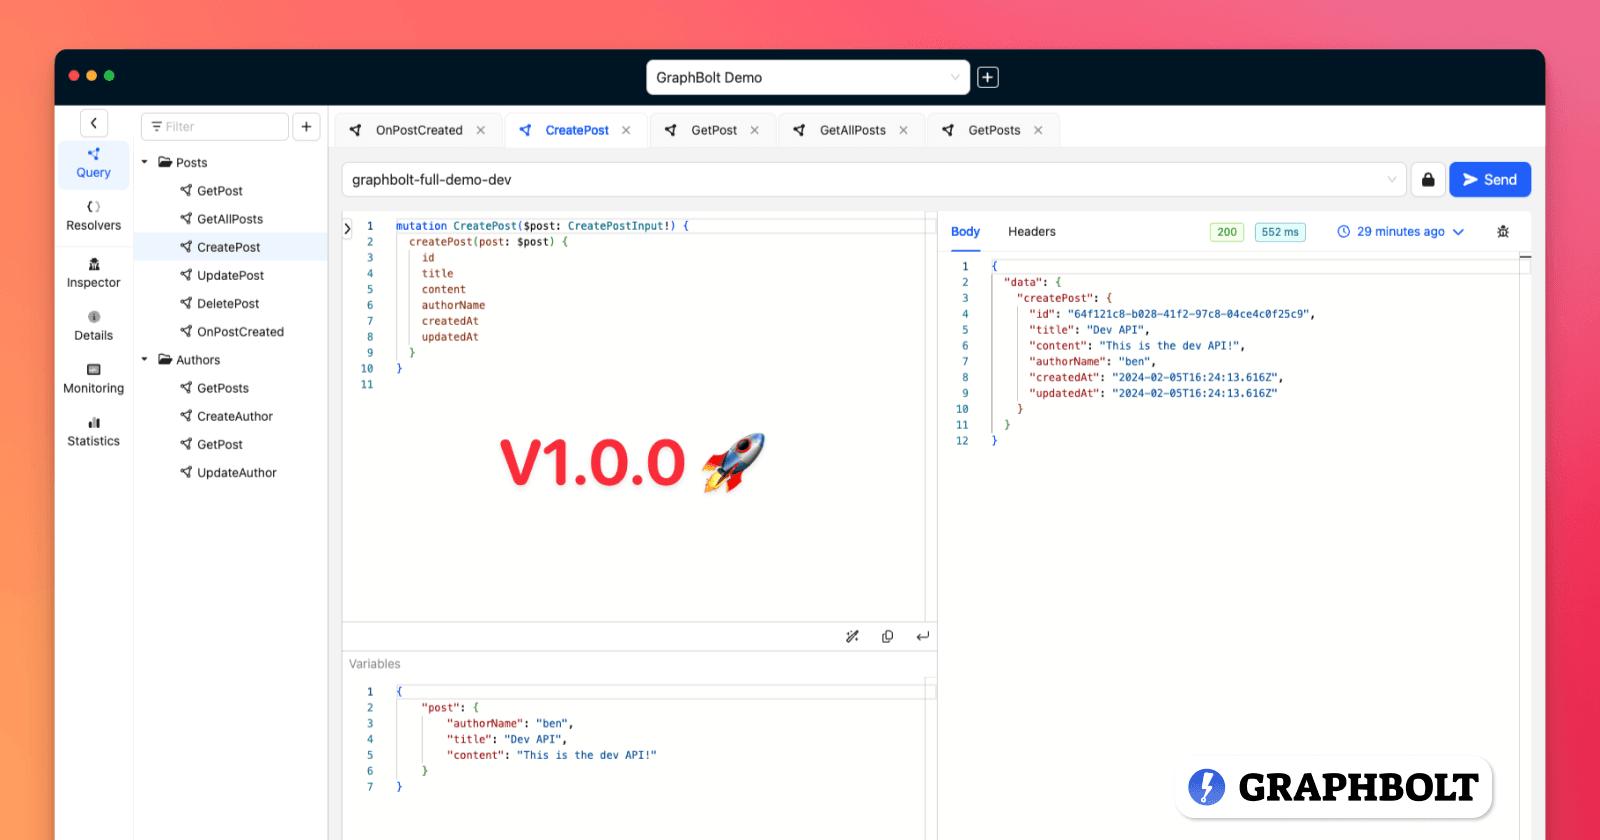
What's new in V1.0.0?
AWS AppSync is a fully managed service by Amazon Web Services that allows developers to create secure and scalable GraphQL APIs easily.
One of the great benefits of AppSync is the ability to connect GraphQL schemas to data sources like DynamoDB by writing simple functions called resolvers, without having to worry too much about data fetching logic. However, when things are not working as expected, it becomes necessary to understand how those resolvers interact with your data sources and the GraphQL schema in order to fix the problem.
Like many other services, AppSync gives you the option to send logs into AWS CloudWatch. When enabled, AppSync writes records describing how resolvers interact with the schema and the data sources.
In this article, I will teach you how to find your way in those logs and understand them so you can effectively diagnose issues.
Before you can dive deep into the logs, you must first enable verbose logging in your API settings. Settings under Logging should look like this:
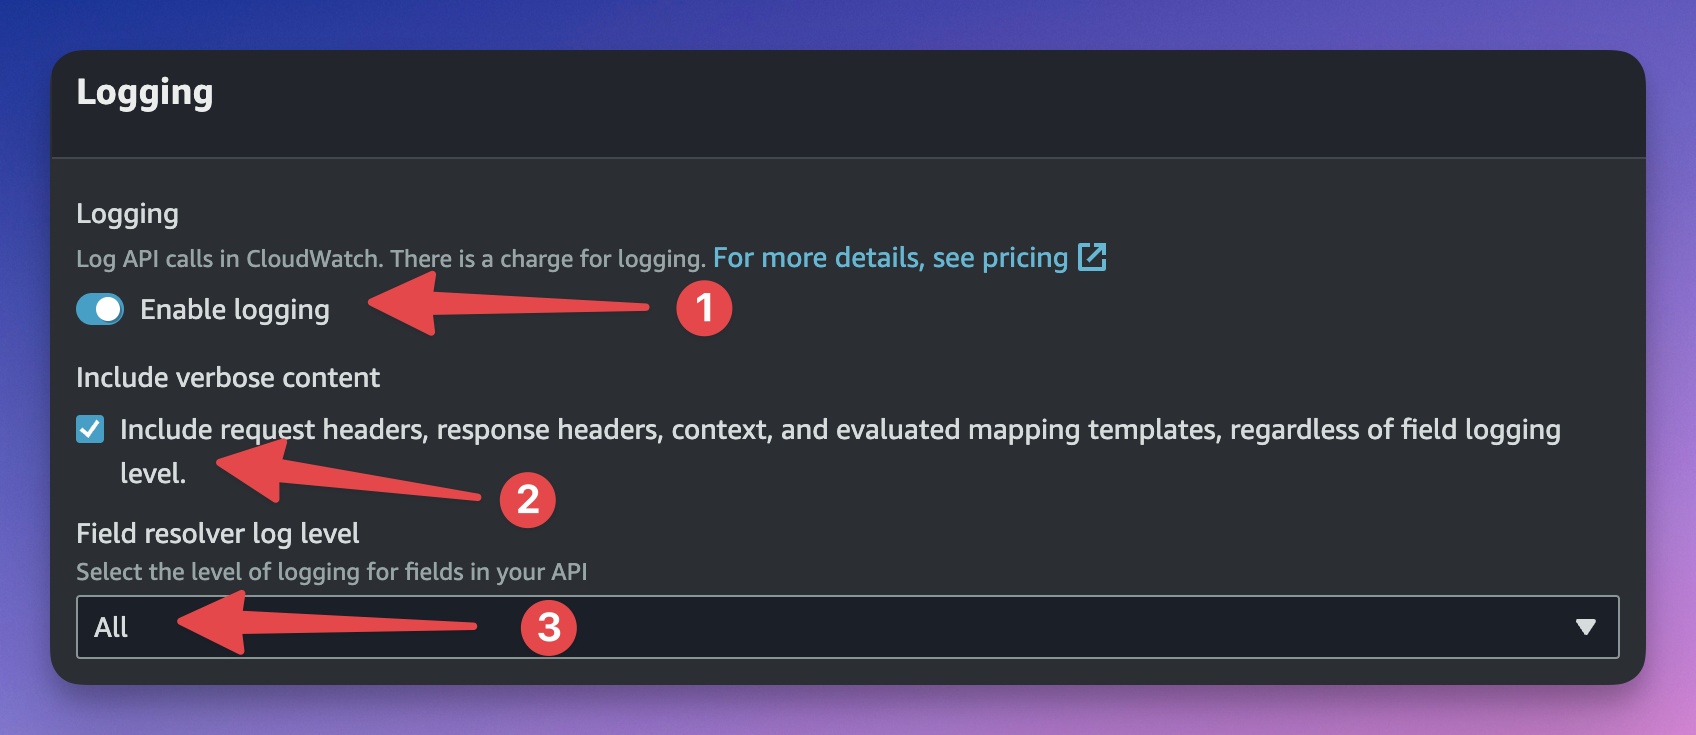
Enable Logging is on ✅
"Include request headers, response headers, context, and evaluated mapping templates, regardless of field logging level": is checked ✅
Field resolver log level: All
You can also use your favorite IaC to do so.
If everything is set up properly, you should start seeing logs in CloudWatch after you execute a query.
ℹ️ AWS AppSync Log Groups are usually named as follows:
/aws/appsync/apis/{apiId}
AppSync logs provide very useful information about each step of the execution of the request. Most of the logs are JSON formatted, which makes them easy to parse, read, and search. Let's get to know them:
At the top and bottom of the log stack, you will find some general details about the executed request.
GraphQL QueryThis line gives you information about the query that was executed. It comprises the query itself, the operation name (if any), and the variables (if any). It is prefixed with the request ID.
Example
f89cbf60-2431-44ca-a6f5-44eec32e42e6 GraphQL Query: query GetPost($postId: ID!) {
  getPost(id: $postId) {
    id
    title
    content
    author {
      name
    }
  }
}, Operation: GetPost, Variables: {"postId":"22d38480-ca09-4d6d-9582-428c15af0bb2"}
RequestSummaryIt provides a summary of the execution among which the status (the HTTP response code) and latency expressed in nanoseconds.
{
  "logType": "RequestSummary",
  "requestId": "f89cbf60-2431-44ca-a6f5-44eec32e42e6",
  "graphQLAPIId": "seiizsmq2zfsfk5nkxfl4h46j4",
  "statusCode": 200,
  "latency": 101516439
}
Request HeadersThe request headers of the HTTP request. Prefixed with the request ID.
f89cbf60-2431-44ca-a6f5-44eec32e42e6 Request Headers: {content-length=[228], cloudfront-viewer-country=[FR], sec-fetch-site=[cross-site], x-amzn-requestid=[f89cbf60-2431-44ca-a6f5-44eec32e42e6], x-amz-user-agent=[aws-amplify/3.0.7], x-forwarded-port=[443], via=[2.0 2f66f74411c5a2447c09372eb79e674e.cloudfront.net (CloudFront)], authorization=[****m3s1Lw], sec-ch-ua-mobile=[?0], cloudfront-viewer-asn=[12322], cloudfront-is-desktop-viewer=[true], host=xxxxx.appsync-api.us-east-1.amazonaws.com], content-type=[application/json], sec-fetch-mode=[cors], x-forwarded-proto=[https], accept-language=[en-GB], x-forwarded-for=[88.162.xxx.xxx, 18.68.xxx.xxx], accept=[*/*], cloudfront-is-smarttv-viewer=[false], sec-ch-ua=[" Not A;Brand";v="99", "Chromium";v="104"], x-amzn-trace-id=[Root=1-65245176-4d851b414d05bec92fc373de], cloudfront-is-tablet-viewer=[false], sec-ch-ua-platform=["macOS"], x-amzn-remote-ip=[xx.xxx.xx.xxx], cloudfront-forwarded-proto=[https], accept-encoding=[gzip, deflate, br], x-amz-cf-id=[839VZnCL8GNXiA_RIql-x5zBvjIb2RWGgQW1H3hr4V8sYqQKnC2Vsg==], user-agent=[Mozilla/5.0 (Macintosh; Intel Mac OS X 10_15_7) AppleWebKit/537.36 (KHTML, like Gecko) GraphBolt/0.4.0 Chrome/104.0.5112.102 Electron/20.1.0 Safari/537.36], cloudfront-is-mobile-viewer=[false], x-amzn-appsync-is-vpce-request=[false], sec-fetch-dest=[empty]}
Note: For security reasons, authorization and other sensitive values are obfuscated in CloudWatch. In this example, I have also hidden other private information myself.
Response HeadersThe response headers of the HTTP request. Prefixed with the request ID.
f89cbf60-2431-44ca-a6f5-44eec32e42e6 Response Headers: {X-Amzn-Trace-Id=Root=1-65245176-4d851b414d05bec92fc373de, Content-Type=application/json; charset=UTF-8}
💡 Tip: If X-Ray is enabled in the AppSync settings,
X-Amzn-Trace-Idis the trace id. You can easily copy it to find the x-ray traces.
Tokens ConsumedThe total number of tokens consumed by the request. For more info about tokens, see the documentation.
Also see: The AWS AppSync Limits You Need To Know
f89cbf60-2431-44ca-a6f5-44eec32e42e6 Tokens Consumed: 1
Aside from the logs referring to the global execution of the request, you will also find a series of lines that relate to every resolver execution in the request. Those logs are in JSON format and provide information about the execution of the resolver's handler functions.
As a general rule, you will usually find a pair of records for each resolver execution (one resolver might be executed more than once): one for the request handler, and one for the response handler (a.k.a. request and response mapping templates). You can recognize them by the logType property: respectively RequestFunctionEvaluation and ResponseFunctionEvaluation, or RequestMapping and ResponseMapping, depending on the runtime (APPSYNC_JS or VTL).
For pipeline resolvers, the same applies to every function in the pipeline (i.e. you will find a pair of logs for every function execution). In addition to that, you'll see an additional pair corresponding to the before and after handlers, wrapping all the functions logs: BeforeRequestFunctionEvaluation and AfterResponseFunctionEvaluation(APPSYNC_JS), or BeforeMapping and AfterMapping (VTL).
Here are the relevant fields that you will find in the records and their meaning:
| Field | Description |
graphQLAPIId | The ID of the AppSync API. |
requestId | The ID of the request. |
resolverArn | The ARN of the resolver. |
path | The full path of the field being resolved, as an array. |
parentType | The parent type of the field this resolver is attached to. |
fieldName | The name of the field this resolver is attached to. |
functionName | Pipeline functions only. The name of the pipeline function. |
functionArn | Pipeline functions only. The arn of the pipeline function. |
context | The context object as received by the handler. This includes the arguments, source, stash, result, etc. (identity is excluded for security reasons). |
evaluationResult | JS resolvers only. The JSON object returned by the handler after evaluation. |
transformedTemplate | VTL only. The result of the mapping template after evaluation by the VTL engine. |
fieldInError | Whether the field is in error. This usually happens after you call util.error(), or if the Data Source request is invalid. |
errors | A list of errors (as an array) that might have occurred during the handler evaluation. This includes custom errors (i.e. util.error()), or any error that might have occurred during the execution of the handler (e.g. invalid Data Source request). This would not include errors returned by the data source. (For example: DynamoDB:ConditionalCheckFailedException). Those are usually available under context.error |
Here is an example of a full log record.
{
  "logType": "RequestFunctionEvaluation",
  "fieldName": "getPost",
  "resolverArn": "arn:aws:appsync:us-east-1:379730309663:apis/seiizsmq2zfsfk5nkxfl4h46j4/types/Query/resolvers/getPost",
  "functionName": "getPost",
  "fieldInError": false,
  "evaluationResult": {
    "operation": "GetItem",
    "key": {
      "id": {
        "S": "22d38480-ca09-4d6d-9582-428c15af0bb2"
      }
    }
  },
  "parentType": "Query",
  "path": [
    "getPost"
  ],
  "requestId": "fea8bf05-19a9-4b82-b8fa-a854d8f29737",
  "context": {
    "arguments": {
      "id": "22d38480-ca09-4d6d-9582-428c15af0bb2"
    },
    "prev": {
      "result": {}
    },
    "stash": {},
    "outErrors": []
  },
  "errors": [],
  "graphQLAPIId": "seiizsmq2zfsfk5nkxfl4h46j4",
  "functionArn": "arn:aws:appsync:us-east-1:379730309663:apis/seiizsmq2zfsfk5nkxfl4h46j4/functions/hdmi2bvayzh6zhoudhm6uc5voe"
}
In the above example, we can see the record for the request handler of the Query.getPost resolver. Since it's in a pipeline resolver, we also see the functionName (getPost). We also find the query that was sent to the data source (DynamoDB) under evaluationResult.
Tracing logs provide extra information about the resolution of a field, including those that are not attached to a resolver.
Example:
{
  "duration": 41818411,
  "logType": "Tracing",
  "path": [
    "getPost"
  ],
  "fieldName": "getPost",
  "startOffset": 135988,
  "resolverArn": "arn:aws:appsync:us-east-1:379730309663:apis/seiizsmq2zfsfk5nkxfl4h46j4/types/Query/resolvers/getPost",
  "requestId": "81f08e54-f589-4775-b96f-7bb8ed218539",
  "parentType": "Query",
  "returnType": "Post!",
  "graphQLAPIId": "seiizsmq2zfsfk5nkxfl4h46j4"
}
Most fields are identical to resolver logs; and here are the other interesting ones:
| Field | Description |
startOffset | The time passed, in nanoseconds, between the beginning of the request and the beginning of the resolution of this field. |
duration | The total duration of the field resolution, in nanoseconds. |
returnType | The type of the field. |
Did you know that you can write custom logs from your resolvers?
In a JavaScript resolver, you can call console.log() or console.error(). If you're still using VTL, use $util.log.info() or $util.log.error(). You will see them appear in CloudWatch along with the file name (if you included a source map), the line number, and the log level (INFO or ERROR). Use them to log custom data or debugging information.
console.log('Hello from a JS resolver request handler!!');
fea8bf05-19a9-4b82-b8fa-a854d8f29737 INFO - resolvers/getPost.ts:11:2: "Hello from a JS resolver request handler!!"
You can even write plain objects, and they will appear as JSONs.
console.log({ hey: 'there' });
2ab4b798-8941-47d1-9f66-453389e5d67c INFO - resolvers/getPost.ts:12:2: {"hey":"there"}
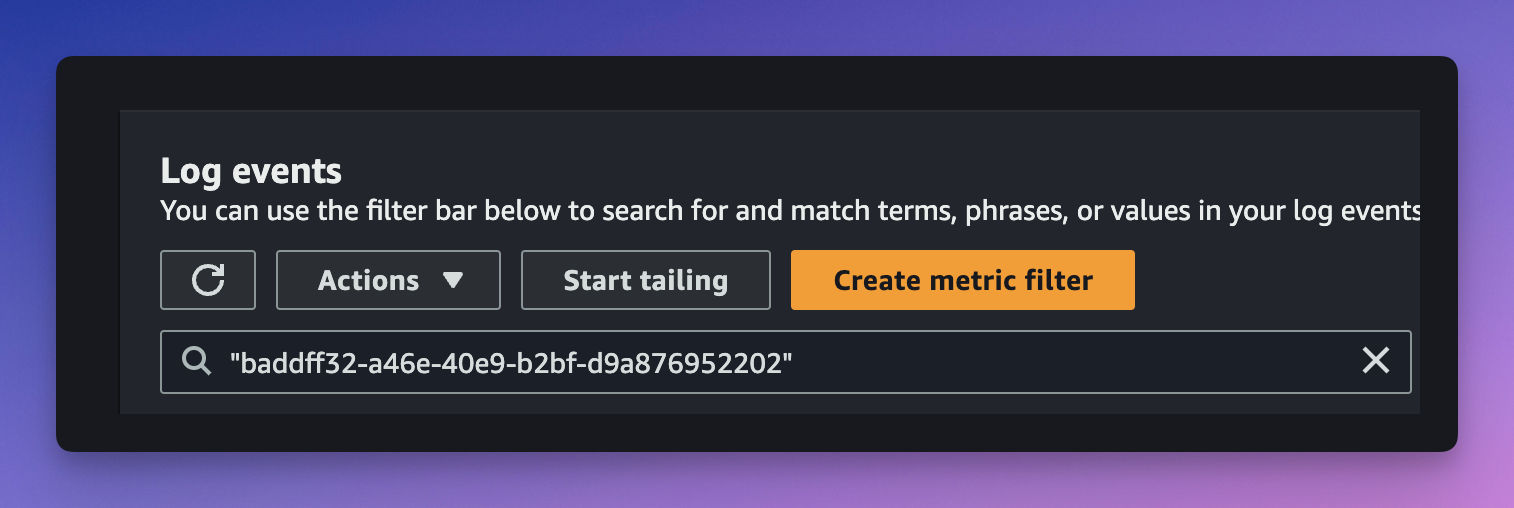
AppSync logs in CloudWatch can be very (very) verbose, and it's not always easy to find what you're looking for among hundreds of lines of logs.
Luckily, AWS AppSync returns the request ID in the x-amzn-requestid HTTP response header.
If you're using an app like Postman to execute queries, you can easily find it and copy it (You can also find it in the Network tab of your browser's developer console). You can then paste it into CloudWatch to filter the logs of that particular request.
Note: You'll need to wrap the ID in quotes.
Alternatively, if you know exactly what you are looking for, you can also use a JSON filter.
For example, if you are interested in the request handler of the getPost query, for a request with the ID 278d0f86-83e8-417f-8985-6fa57ab7e5bd, you can apply the following filter:
{ $.requestId = "278d0f86-83e8-417f-8985-6fa57ab7e5bd"
  && $.logType = "RequestFunctionEvaluation"
  && $.fieldName = "getPost" }
ℹ️ Note: Logs can take a few seconds to show up in CloudWatch. If you just executed the request, you might need to refresh a few times before you see them.
Once you understand how logs are structured, how they appear in CloudWatch, and how to find them, it becomes much easier to debug requests. Let's take a common mistake as an example.
Imagine you wrote the following JS resolver code:
export function request(ctx) {
  return {
    operation: 'GetItem',
    key: util.dynamodb.toMapValues({
      id: ctx.arguments.postId,
    }),
  };
}

export function response(ctx) {
  return ctx.result;
}
You're sending this query.
query {
  getPost(id: "f9f621c6-d9da-4880-a148-69535a118494") {
    id
    title
    content
  }
}
And this is the GraphQL schema corresponding to that request.
type Query {
  getPost(id: ID!): Post!
}
After executing the request, you receive this response:
{
  "data": null,
  "errors": [
    {
      "path": [
        "getPost"
      ],
      "locations": null,
      "message": "Cannot return null for non-nullable type: 'Post' within parent 'Query' (/getPost)"
    }
  ]
}
You are certain that the post exists, you checked in your DynamoDB table. So what is going on? Let's have a look at the logs. First, let's identify the request handler logs to see if we see anything. We're looking for a RequestFunctionEvaluation log for the getPost resolver.
After looking in CloudWatch, I found it:
{
  "logType": "RequestFunctionEvaluation",
  "path": [
    "getPost"
  ],
  "fieldName": "getPost",
  "resolverArn": "arn:aws:appsync:us-east-1:111111111111:apis/seiizsmq2zfsfk5nkxfl4h46j4/types/Query/resolvers/getPost",
  "requestId": "f9f621c6-d9da-4880-a148-69535a118494",
  "context": {
    "arguments": {
      "id": "22d38480-ca09-4d6d-9582-428c15af0bb2"
    },
    "stash": {},
    "outErrors": []
  },
  "fieldInError": false,
  "evaluationResult": {
    "operation": "GetItem",
    "key": {
      "id": {}
    }
  },
  "errors": [],
  "parentType": "Query",
  "graphQLAPIId": "seiizsmq2zfsfk5nkxfl4h46j4"
}
The first thing you would usually look at would be the evaluationResult which is the request that was sent to the data source (in this case DynamoDB). Here, something does not look right. You can see that the key value of the GetItem operation is empty. The ID is not sent correctly to DynamoDB.
We can confirm that by looking at the corresponding ResponseFunctionEvaluation record. DynamoDB complains about an invalid key (See context.error).
{
  "logType": "ResponseFunctionEvaluation",
  "path": [
    "getPost"
  ],
  "fieldName": "getPost",
  "resolverArn": "arn:aws:appsync:us-east-1:379730309663:apis/seiizsmq2zfsfk5nkxfl4h46j4/types/Query/resolvers/getPost",
  "functionName": "getPost",
  "requestId": "81f08e54-f589-4775-b96f-7bb8ed218539",
  "context": {
    "arguments": {
      "id": "22d38480-ca09-4d6d-9582-428c15af0bb2"
    },
    "prev": {
      "result": {}
    },
    "stash": {},
    "error": {
      "message": "The provided key element does not match the schema (Service: DynamoDb, Status Code: 400, Request ID: HUDP47TVTALEGM8NB90JVLK5RRVV4KQNSO5AEMVJF66Q9ASUAAJG)",
      "type": "DynamoDB:DynamoDbException"
    },
    "outErrors": []
  },
  "fieldInError": false,
  "errors": [],
  "parentType": "Query",
  "graphQLAPIId": "seiizsmq2zfsfk5nkxfl4h46j4",
  "functionArn": "arn:aws:appsync:us-east-1:379730309663:apis/seiizsmq2zfsfk5nkxfl4h46j4/functions/hdmi2bvayzh6zhoudhm6uc5voe"
}
This is a sign that something is wrong with the request handler. Let's double-check it, and pay attention to the key part.
    key: util.dynamodb.toMapValues({
      id: ctx.arguments.postId,
    })
We're sending ctx.arguments.postId. Let's check the arguments that were received by the handler to confirm the value (They are in the context property).
{
    "arguments": {
      "id": "22d38480-ca09-4d6d-9582-428c15af0bb2"
    },
    "stash": {},
    "outErrors": []
  }
If you look closely, there is a typo in the request handler. The GraphQL query (schema) takes id as an argument, but the request handler sends postId 🤦♂️.
The request handler should look like this
export function request(ctx) {
  return {
    operation: 'GetItem',
    key: util.dynamodb.toMapValues({
      id: ctx.arguments.id,  // <-- fixed argument
    }),
  };
}
After re-deploying, everything works as expected. 🎉
As you can see, the logs can help you easily identify issues due to invalid request/response handlers code. context and evaluationResult are very useful to see what happened inside the resolver and how it interacted with the data source.
💡 Tip: With the use of TypeScript to write AppSync resolvers, it also becomes easier to detect those kinds of mistakes in advance.
GraphBolt is a tool that makes it much easier for developers to test their AppSync APIs. It packs everything you need in one desktop application, including a powerful GraphQL client. It also makes it super easy to debug requests.
Let's take our previous use case, and see how GraphBolt would have helped us find the issue faster.
After executing the request directly from the app, I see an error in the response panel (1). At this point, I have no clue where the problem is.
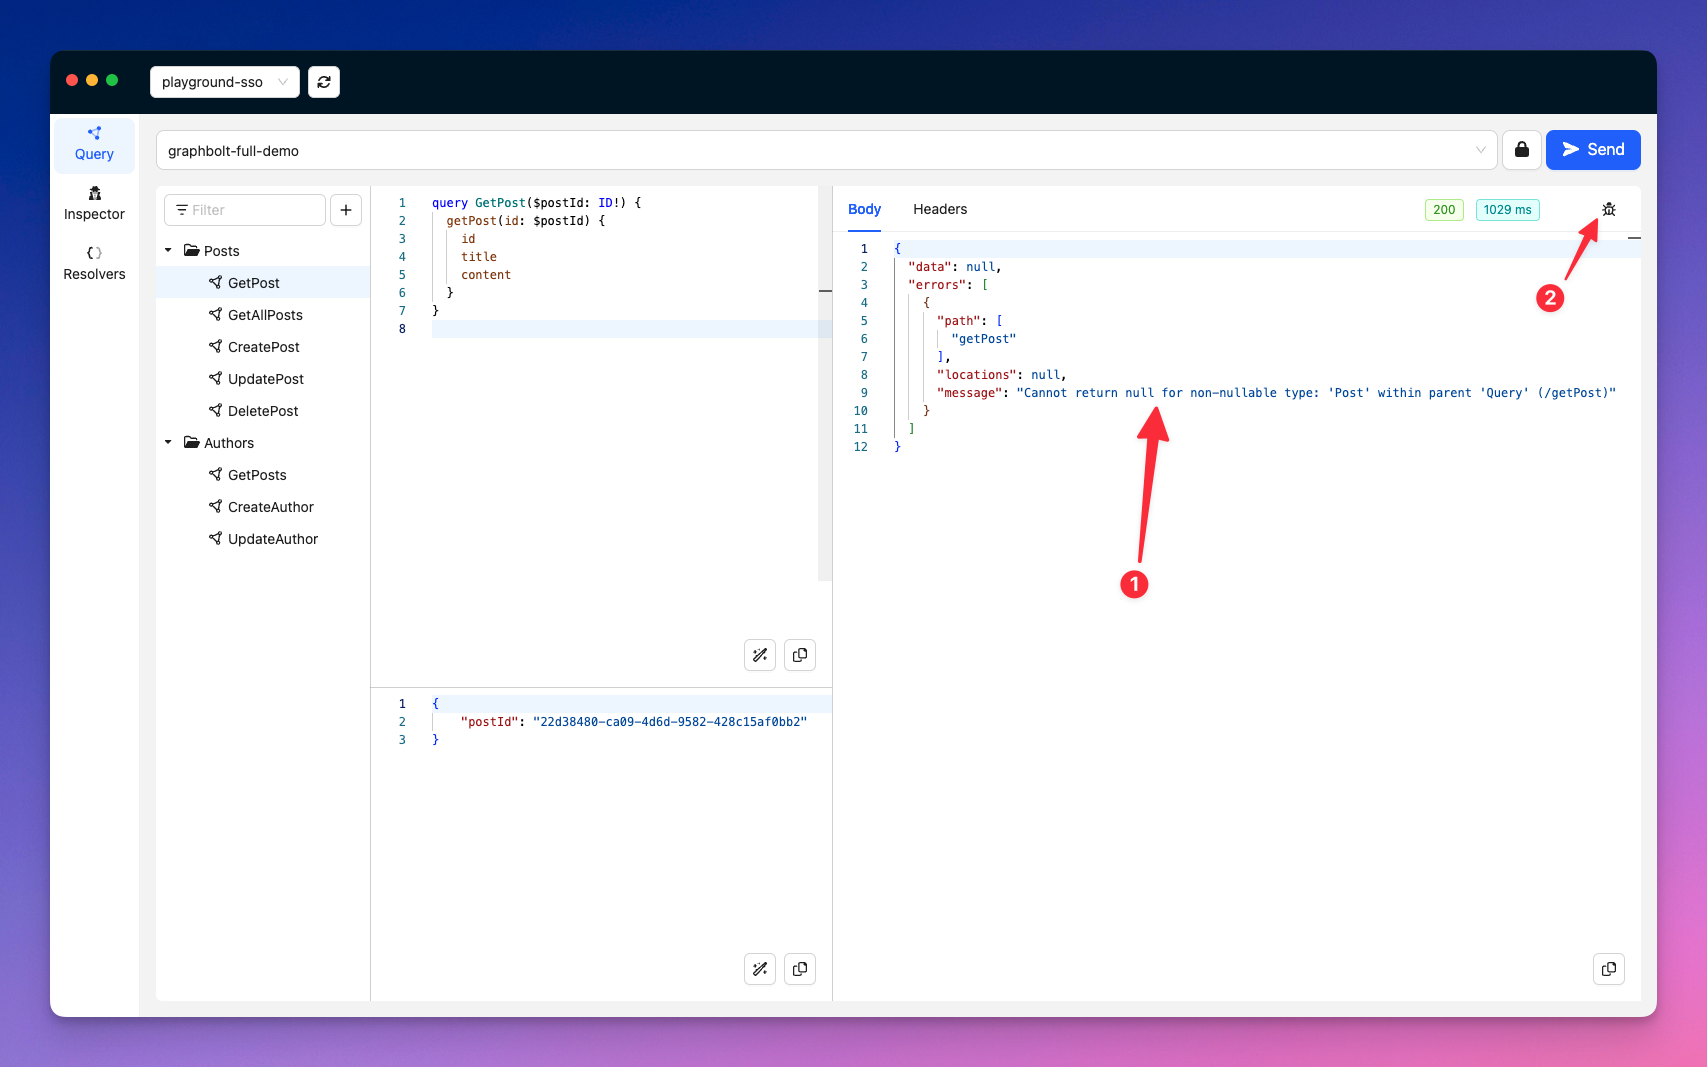
I click on the debug button (2). After a few seconds, it shows information about the last executed request, including resolver evaluations and their data sources, x-ray traces, request and response headers, and CloudWatch logs.
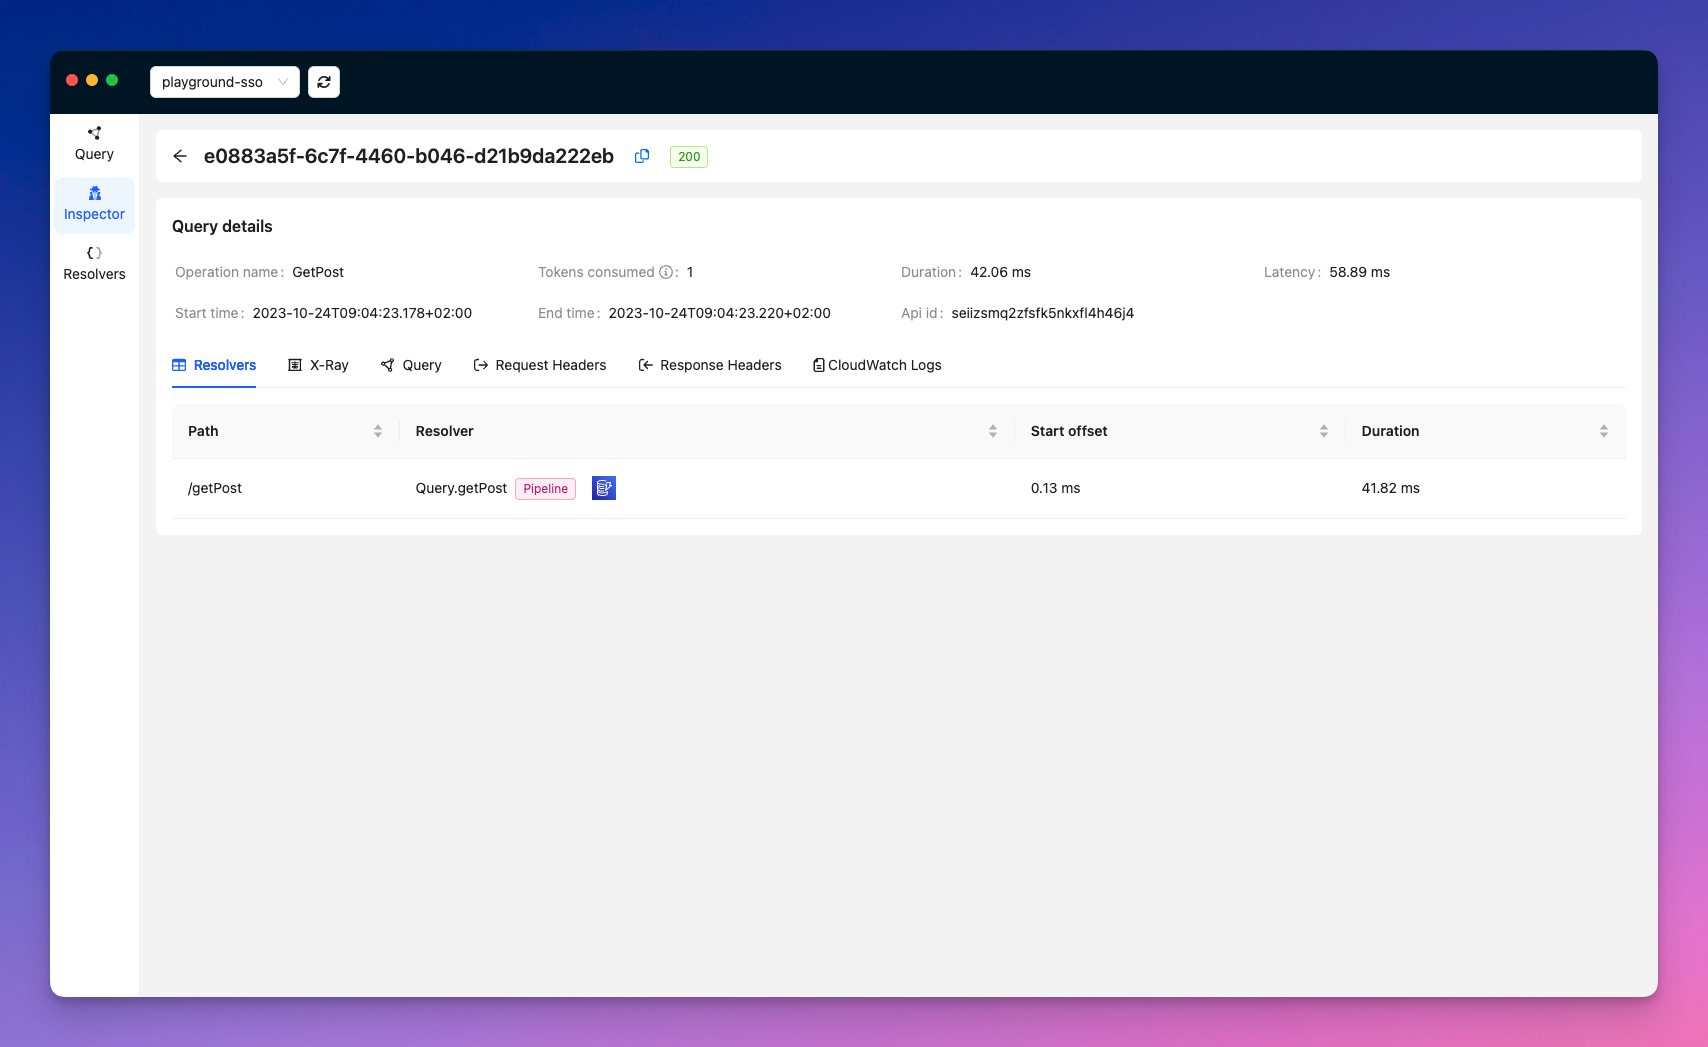
I'm interested in the getPost resolver which did not return the expected result, so I click on it in the list to get more details. A modal opens. It contains information about the execution of the resolver.
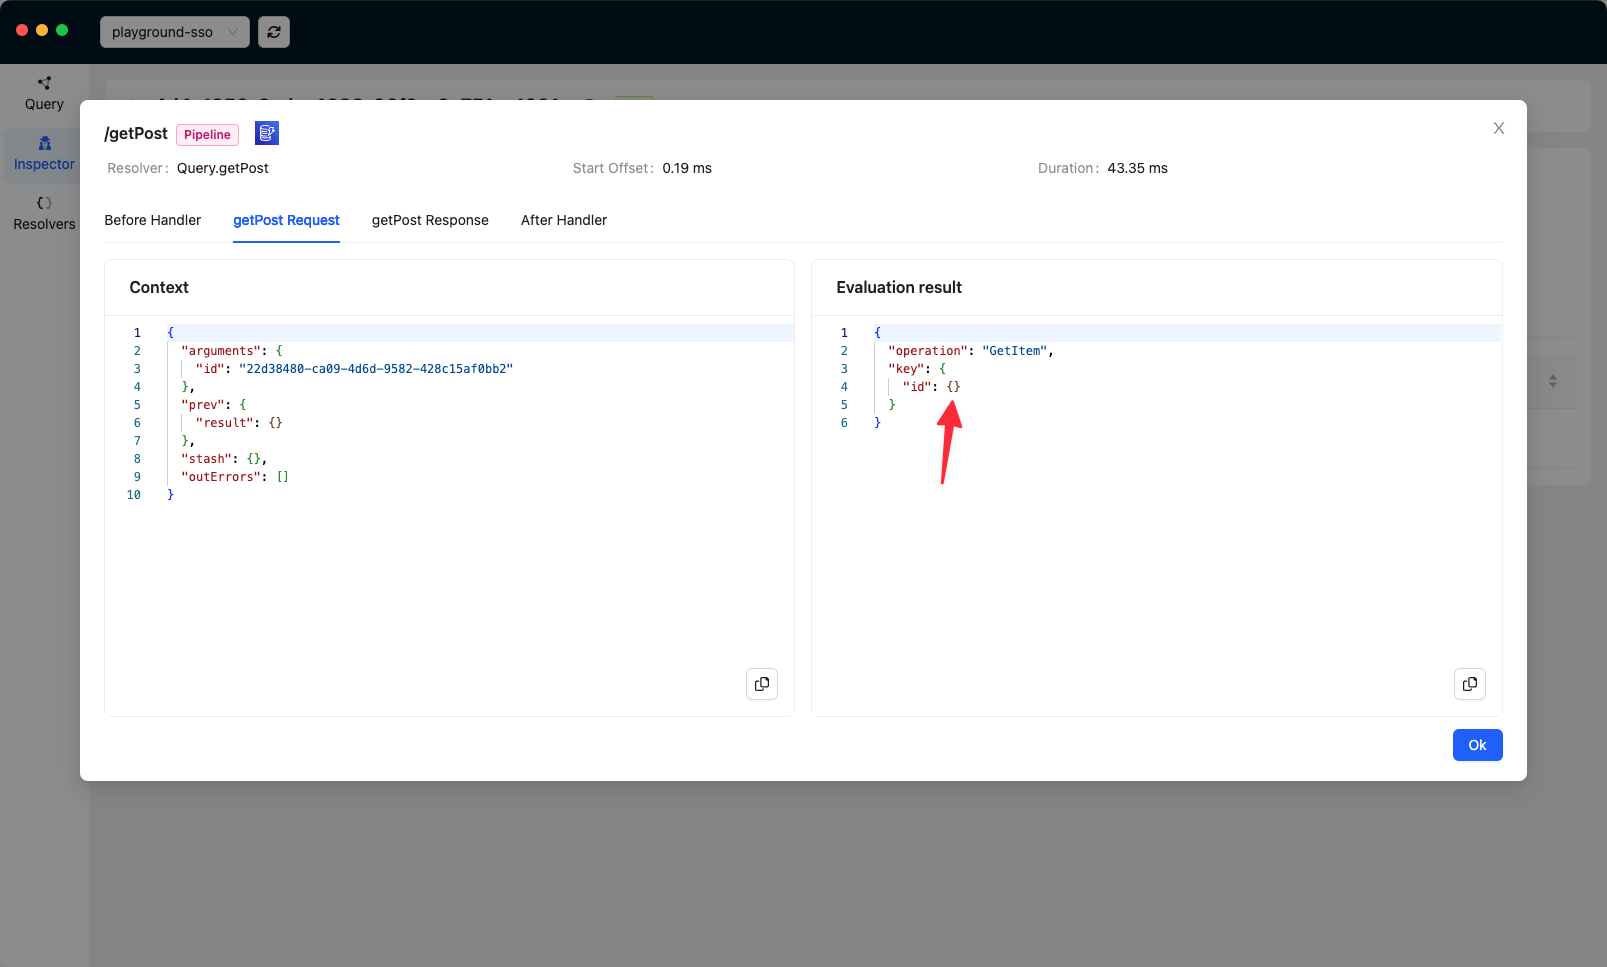
By looking at the getPost Request tab, I can see the context object received by the request handler of my pipeline function on the left side; and its evaluation result on the right side. I can immediately see that the operation sent to DynamoDB is wrong.
The getPost Response tab also shows me the error returned by DynamoDB.
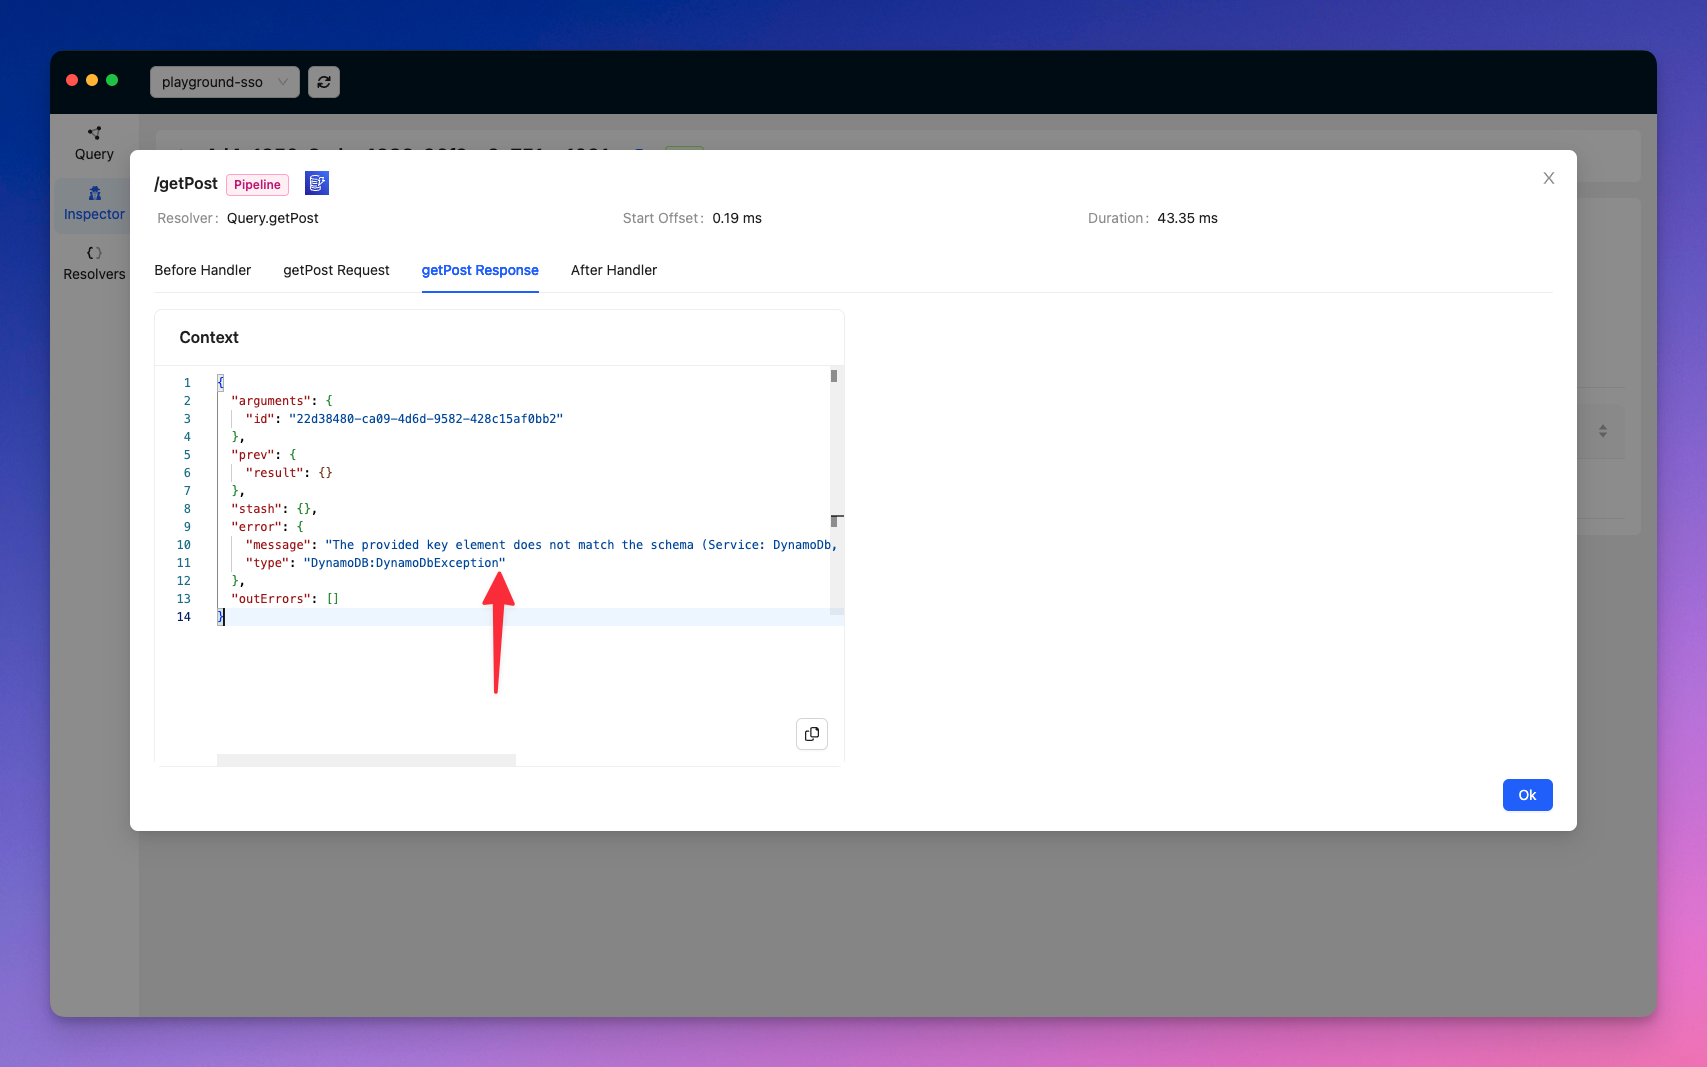
All that, in just a few seconds, without leaving the app and going through CloudWatch logs 🙌
GraphBolt has plenty of other features to help you test, and debug AppSync APIs. Try it for free today!
Debugging AppSync requests is not a free lunch, but with the right knowledge and tools, it becomes easier. In the article, I showed you how to decode AppSync CloudWatch logs and use them to debug GraphQL requests. I also showed you how GraphBolt can help you make this process even quicker and easier.
Happy GraphQL coding!
Image credits: Image generated with krea.ia, and edited with Adobe Firefly.